
The 1997 Manual / Section 2
Analyzing Market
From the PizzaSMARTS Database Marketing Manual, updated January 1, 1997. Download the full PDF.
On this page
- Analyzing Your Market
- Market Penetration Analysis
- Marketing Battle Map
- Pizza Customer Market Penetration
- Divide and Conquer
- Do You Know Your Customers…? Customer Types
- Customer Activity Report Guide
- Sample Customer Activity Report
- Qualitative Information
- Surveying Your Marketing Area
- Quality, Service, Price Survey
- How Monroe Views the Pizza Market
- Survey Results for Sal’s Pizza
Analyzing Your Market
The first step in the database sales building process begins with an analysis of your market. In analyzing your market, we are trying to find out what is special and unique about your market so that we can deliver the right messages to the right people in your area.
We are not overly concerned with the demographic, lifestyle, or psychographic characteristics of your area. Your store is already located where it is and it is now your job to sell more to the people who live there regardless of their demographics or any other classification. Since we can’t change the demographics of your customers, we will instead concentrate on changing their minds about your business.
Your database contains information that is far more powerful than any demographic, lifestyle, or psychographic statistical model. Nothing. Nothing has the power to predict the future buying behavior of your customers better than previous buying behavior. Recency and frequency are the key factors that we will be using to classify customers in your market because this tells us precisely just how each resident of your market feels about your business. If actions speak louder than words, then we will be hearing very clearly from your customers because their actions are recorded within your database.
There are three major ways that we will statistically analyze your market. This is important to know before we begin marketing but it is even more important as time goes on to observe the changes in these statistics and relate them to our marketing efforts.
- Market Penetration
This will tell us precisely where your business is coming from and how cost effective it is to market in various areas of your market. - Purchase Frequency
This will tell us how loyal your customers are and how responsive they are to promotions. - Qualitative Information
This information is gathered through periodic short-and-simple telephone surveys to determine the competitive position and image of your business and your competition’s.
Market Penetration and Purchase Frequency should be to marketing,
what Food and Labor statistics are to operations.
Market Penetration Analysis
This section will help you understand your report entitled “MPA” report
The market penetration rate is a very important statistic that measures your relative influence with potential customers based on their address location. A market penetration map is the closest thing to a photograph of your business you will ever see. You can see where your customers are coming from Where you have the most influence. How competition and traffic patterns can warp the neat population radius you expected to see. A market penetration analysis is much more useful than the better known “sector analysis” because it compares success in each area to the actual number of people that live in that area. Notice in the MPA report that each significant postal carrier route is listed with the number of customers and total households for each carrier route. The market penetration rate (Pen/Rate) is calculated for each postal carrier route by dividing the number of customers by the number of households that receive mail. Lastly, all carrier routes are ranked according to their MPA superiority. (Market Penetration Rate)
This is a highly important statistic to know. For whatever reason it might be—the right demographic, lack of competition, proximity to the store—you’ll have much more influence with some carrier routes in your market than others. This would be unknown to you without this analysis. The most favorable one-third of carrier routes according to their market penetration percentage are called red zone carrier routes. The next important one-third of carrier routes are called yellow zone carrier routes. The least important one-third of carrier routes are called blue zone carrier routes. Red (hot), Yellow (medium), Blue (cold).
The map provided shows where each of the postal zones or carrier routes are located. The carrier routes on the map represent 90-95% of your total customers. The bottom 5-10% have been deleted due to low penetration in the carrier route. It is not worthwhile marketing to them since they represent an average market penetration rate of less than 2%.
The number of customers within each postal zone have been counted and then compared to the number of addresses reported by the Post Office to exist within the postal zone. Only those customers having ordered during the last three months are considered to be customers.
We recommend marketing to all customers regardless of where they are in your market. However, when it comes to recruiting non-customers, the red zones are the best place to start recruiting. Here your non-customer response rates will be significantly higher than from other parts of your market.
Code
- Zip
- Zip Code
- Cart
- Carrier route
- Cust
- The number of customers within the carrier route
- Pop
- Population of carrier route from US Postal Data
- Penrte
- Penetration Rate (3 months)
Customers as a percentage of carrier route population - Map
- Color code reference on map
- Totrat
- Subtotal of market penetration rate for each of the three map color zones
* The zone numbers on the map are made up of the zip code and the carrier route. The first two numbers are the last two numbers of the zip code and the last two numbers are the last two numbers of the carrier route. If there is an “R” in the number, it refers to a rural route.
Marketing Battle Map
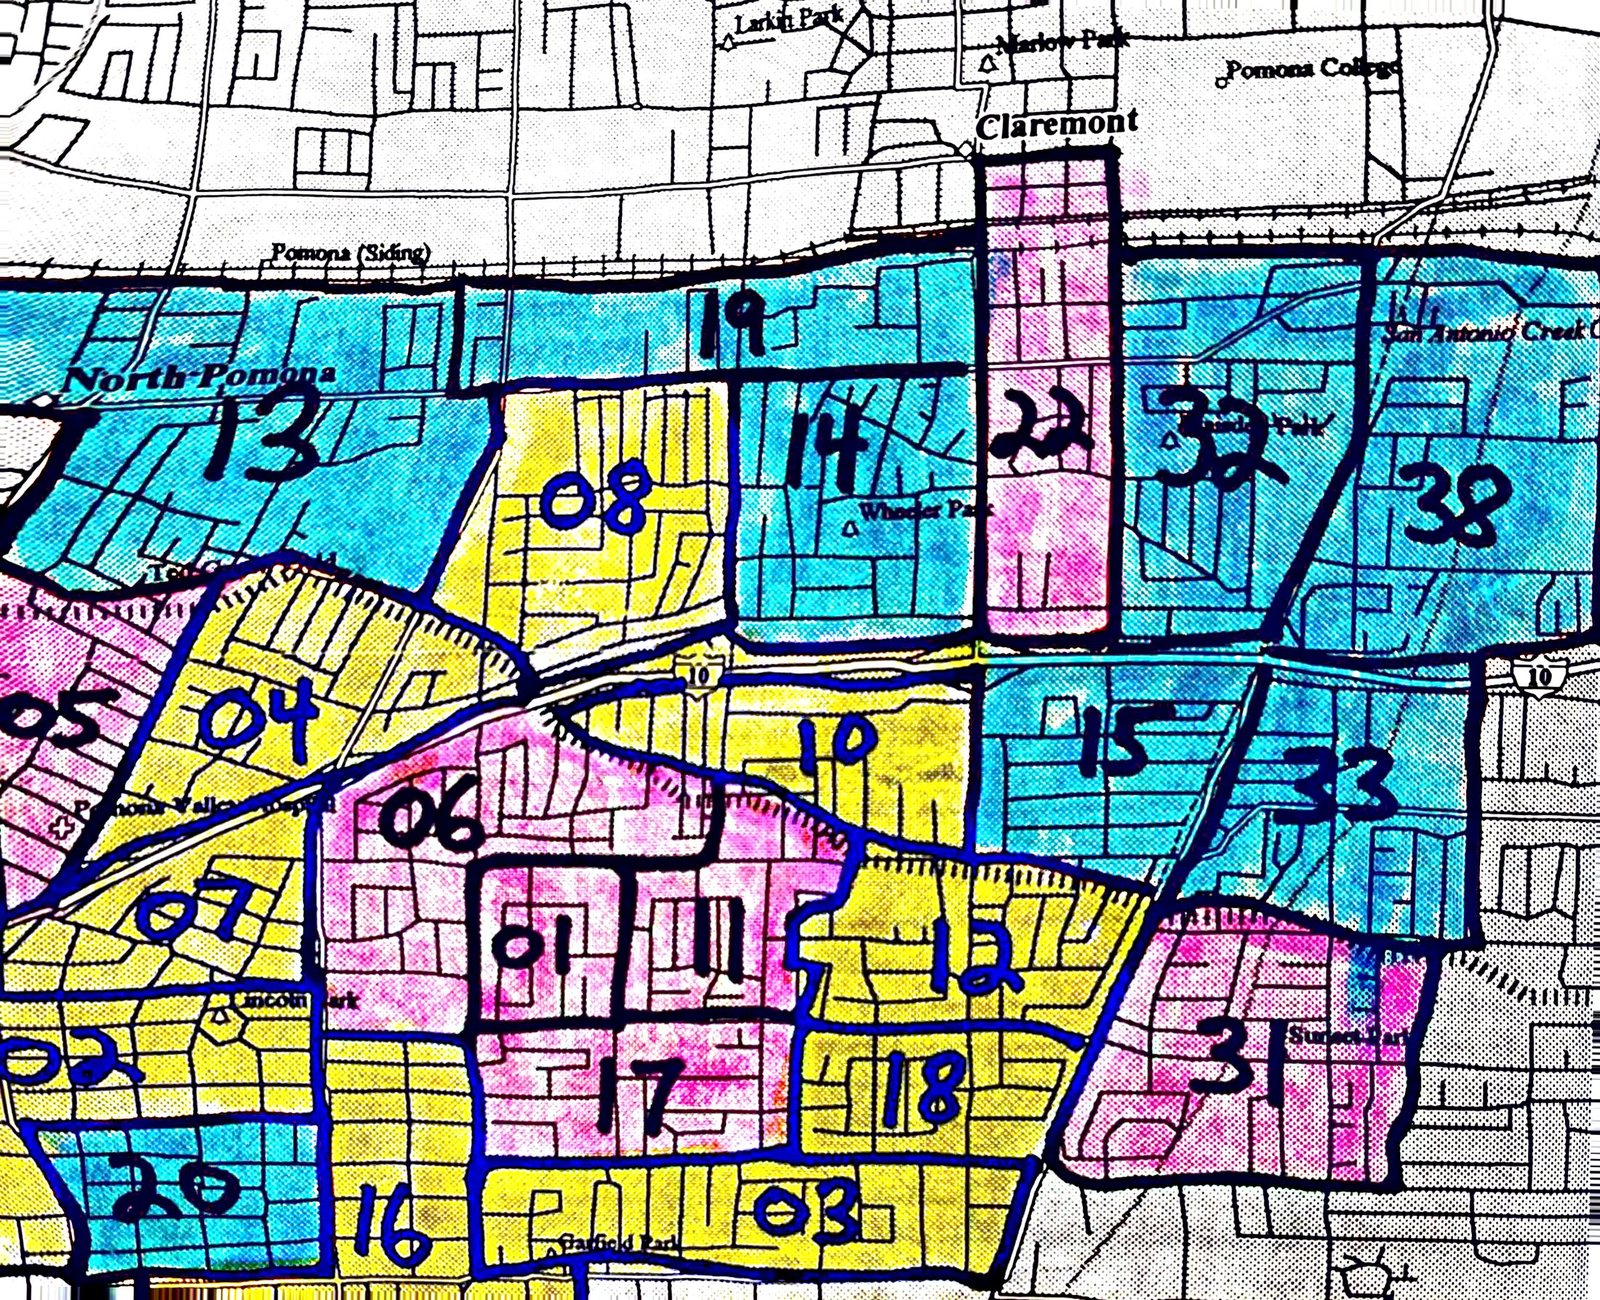
Pizza Customer Market Penetration
| Map | Cart Zone | Customers | Households | Penetration Rate |
|---|---|---|---|---|
| Red | Map 05 | 71 | 122 | 58.20% |
| Red | Map 22 | 171 | 350 | 48.86% |
| Red | Map 31 | 62 | 128 | 48.44% |
| Red | Map 06 | 121 | 259 | 46.72% |
| Red | Map 01 | 110 | 251 | 43.82% |
| Red | Map 11 | 40 | 92 | 43.48% |
| Red | Map 08 | 163 | 390 | 41.79% |
| Red | Map 17 | 106 | 263 | 40.30% |
| Subtotal | All Red | 844 | 1855 | 45.50% |
| Yellow | Map 18 | 103 | 258 | 39.92% |
| Yellow | Map 04 | 156 | 412 | 37.86% |
| Yellow | Map 10 | 135 | 372 | 36.29% |
| Yellow | Map 07 | 86 | 251 | 34.26% |
| Yellow | Map 12 | 144 | 428 | 33.64% |
| Yellow | Map 02 | 104 | 311 | 33.44% |
| Yellow | Map 16 | 128 | 385 | 33.25% |
| Yellow | Map 03 | 128 | 388 | 32.99% |
| Subtotal | All Yellow | 984 | 2805 | 35.08% |
| Blue | Map 14 | 70 | 215 | 32.56% |
| Blue | Map 19 | 82 | 258 | 31.78% |
| Blue | Map 32 | 84 | 274 | 30.66% |
| Blue | Map 13 | 108 | 354 | 30.51% |
| Blue | Map 33 | 89 | 366 | 24.32% |
| Blue | Map 20 | 140 | 643 | 21.77% |
| Blue | Map 15 | 42 | 348 | 12.07% |
| Blue | Map 38 | 55 | 457 | 12.04% |
| Subtotal | All Blue | 670 | 2915 | 22.98% |
| Total | All | 2498 | 7575 | 32.98% |
Nothing helps you visualize your otherwise intangible business like a market penetration battle map. It’s the closest thing to a photograph of your business.
The map can be used to graphically determine your functional market reach and it allows you to focus your marketing efforts more surgically. You will be able to monitor progress and take action in the same way that a general would want to command his forces while engaged in battle.
Refer to your battle map each month when reviewing your market Penetration Report. You will witness geographic victories and losses depending on your marketing efforts. Combine and focus your marketing efforts by zone, or by customer type. Managers will now be able to see the actual results of doorhanging and other local store marketing efforts. Pursue customers wherever they live, but focus on non-customers in the red zones first. (Your response rates will be higher).
Divide and Conquer
Nothing predicts purchasing potential better than previous purchasing activity. The information within your sales records allows you to divide your customers into the most significant and relevant marketing groups. They are grouped by how they feel about your business, as expressed by their purchasing patterns.
a) Regular Customer (Anyone ordering during last three months).
Purchase frequency and ticket price can be improved by sending messages designed to influence customers towards buying more and more often. If you can induce just one additional purchase per customer every two months, your store sales will increase by 25%. Successful marketing to this group should produce a positive impact on Customer Activity Report, Statistic 22 (Purchase Frequency).
b) Non-Customer (Hasn’t ordered during last three months)
Enlarge your customer base. Increase your market penetration by converting non-customers into customers. Since you know who your customers are, a database merge/purge will allow you to market directly to non-customers. Send non-customers advertising that is radically different from what you have sent them in the past. After all, they have consistently rejected your previous advertising. Successful marketing to this group should produce a positive impact on Customer Activity Report, Statistic 10 (3 Month Penetration Rate).
c) New Customer (First time to appear in computer database)
This is a relatively small but very important group that is critical in the building of your business. These customers are especially fickle, difficult to retain, and usually go unnoticed. Be sure to give them a special welcome and a good reason to return. Successful marketing to this group should produce a positive impact on Customer Activity Report, Statistic 21 (First-Time Customer Retention Rate).
d) Fading Customer (Last ordered three months ago but not since)
Increase the rescue rate of fading customers by contacting them when they have broken their favorable buying patterns. Successful marketing to this group should produce a positive impact on Customer Activity Report, Statistic 18 (C Customer Rescue Rate).
Do You Know Your Customers...?
Customer Types
Great Customer. He always buys. Increase purchasing by promoting bigger pizzas, promotional items, etc.
Recommendations:
- Light offers.
- Premium offers.
- Thank you card from manager.

Good Customer. She sometimes buys. Needs moderate offers. This is an average customer.
Recommendations:
- Moderate offers.
- Dollar off questionaire postcard.
- Offer a lunch special.

Fading Customer. He used to buy. You are losing this customer. He hasn’t bought a pizza in over 2 months. He may be dissatisfied. Get him back, Quick!
Recommendations:
- Heavy offers.
- Phone call.
- Survey, give $2.00 coupon for filling out survey.

Non-Customer. She does not buy. Heavy coupons may bring her into your shop. As you improve her customer status, you can wean her from her dependency on coupons.
Recommendations:
- Very heavy offers.
- Earn $5.00 coupon by answering survey.
- Letter and gift certificate.

Customer Activity Report Guide
There are two ways to increase sales. Getting more customers and getting the customers you already have to buy more often. We now have a statistic to measure each of these sales components.
As discussed with regard to the MPA, the market penetration rate will tell us how successful we have been in recruiting new customers. The other statistic that we are very interested in is our purchase frequency as reported on the Customer Activity Report (CAR). Observing changes in this number will tell us how well we are able to get the customer to increase their purchases.
Purchase frequency is calculated by taking the number of transactions during the month and dividing it by the number of households that made a purchase that month. Purchase frequency is broken down by geography and by customer type in order to be able to measure doorhanging, mailing, or even telemarketing impact.
If you have a very high market penetration rate but a relatively low purchase frequency rate, you may want to spend your first marketing dollars on raising purchase frequency. If you have a very high purchase frequency among a limited group of customers, then your biggest potential may be with enlarging the size of your customer base.
CODE
Please understand that the following is to be used as a reference to your Customer Activity Report. The two most important statistics are Market Penetration and Purchase Frequency, and secondarily Lost Customer Rescue Rate and New Customer Retention Rate.
A customer is defined by a unique phone number and address together. This means that one household with two phone numbers will be counted as two customers. A mailing target or household is defined as a unique address only, as in the case of a mailing where only one mail piece would be sent to each mailable address.
- Total Database - This the total number of ordering phone numbers that have a mailable address plus all of the addresses of non-customers that are capable of being mailed.
- Customers Ordering - This is the number of active customers (A’s, B’s and C’s). Active customers are those who have ordered during the last three months. When you look back over the history of an average store for a six month period, 85% of all of your customers appear during the last three months. The average number of customers ordering is between 15% and 35% of all addresses in the delivery area.
- "A" Customers - These are your best customers. They buy frequently and often. An "A" customer must have, at a minimum, bought continuously for the last two months.
- "B" Customers - These customers show a moderate but uncertain loyalty. "B" customers may be too new to have shown a discernible buying pattern, or they may go for short periods without ordering.
- "C" Customers - A "C" customer is a customer who has gone for two straight months without ordering. Now he is a "C" customer for one month and one month only. Paying special attention to your "C" customers can result in plugging the customer drain and getting valuable customer feedback. If a "C" customer buys during the next month, he will become a "B" customer. If he doesn’t, he becomes a "D" customer.
- "D" Customers - A "D" customer is a non-customer. On the average, 75% of everyone living in a delivery area is a non-customer. There are two kinds of "D" customers.
- Former "D" Customers - These are customers who have tried your product, but have failed to become a regular customer (former customers).
- Never "D" Customers - These are customers who have never tried your product.
- GPA - The GPA (Grade Point Average) gives you a relative measurement of the quality of your sales. GPA is calculated by assigning four points for every "A" customer, three points for ever "B" customer, and two points for every "C" customer. "D" customers get no points. These figures are added together and then divided by the number of customers. The result will indicate your average customer type. For example, if your GPA is 3.0, your average customer is a "B" customer. As loyalty among your customers grows, and the number of "A" customers increase, your GPA will go up. Long term gain in the GPA indicates a growth in the customer satisfaction level.
- 3 Month Market Penetration - This is one of the two most important statistics generated each month. The number of customers is compared to the number of residents in your market. The number of area residents is calculated by taking the US Postal Delivery statistics for each carrier route within your primary delivery area.
- Monthly Customers - The total number of customers within this store marketing area which actually made a purchase during the report month. Viewing changes here gives you direct response information to any mailings which occurred during the report month.
- New Customers - The total number of new customers which purchased during the report month. This is the response statistic you would view when evaluating the success of a mailing to all "D" or non-customers. There are two sub-categories of new customers: first time customers and recaptured customers.
- First Time Customers - These are new customers who have purchased during the report month but had no previous record of purchasing. This is the report statistic to view when evaluating the success of a mailing to "Never ’D’ customers."
- Recaptured Customers - This is the number of customers who have purchased during the report month that made a purchase previously, but not recently. They were, until this month, considered to be non-customers. This is the statistic to view when evaluating the success of a mailing for "Former ’D’ customers."
- Regular Customers - This is the number of customers ordering this month that were "A," "B," or "C" customers last month.
- Last Month’s "C" Customers - This statistic looks at the number of last month’s "C" or facing customers. This will be a comparison statistic for evaluating the next statistic.
- Lost Customers - This statistic looks at "Last Month’s ’C’ customers," telling us how many of them came back and how many continued their pattern of inactivity becoming lost customers.
- "C" Customers Rescue Rate - The percentage of customers that were rescued. The percentage of last month’s "C" customers that ordered this month.
- Last month’s First Timers - This is the number of customers who ordered for the first time last month.
- Purchase Again - This statistic looks at "Last Month’s First Timers," telling us how many of them ordered again this month.
- First Timer Retention Rate - The percentage of first time customers making a come back and ordering again.
- Purchase Frequency - This is one of the most important statistics generated each month. This is the total number of orders made by customers, divided by the number of customers.
- "A" Customer Purchase Frequency - The number of orders made by "A" customers divided by the number of "A" customers.
- "B" Customer Purchase Frequency - The number of orders made by "B" customers divided by the number of "B" customers.
- First Timer Purchase Frequency - The number of orders made by the first time customers this month, divided by the number of first time customers.
- Regular Customer Purchase Frequency - The number of orders made by regular customers this month, divided by the number of regular customers.
- One Month Market Penetration Rate - The number of customers active this month divided by the number of addresses within the primary marketing area.
- Address Error Rate - This compares the number of unmailable addresses that appear on the error report to the total number of addresses from the newly downloaded computer database. As management corrects store database with regard to the addresses that appear on the address error report, the address error rate will decrease.
Sample Customer Activity Report
Store 2
Customer Activity Report
Activity for July, 1999
| Last Month | This Month | Monthly Change (%) | |
|---|---|---|---|
| 1. Total Database Records | 5435 | 5524 | 1.64 |
| 2. Customers | 2613 | 2660 | 1.80 |
| 3. A Customers | 791 | 828 | 4.68 |
| 4. B Customers | 1356 | 1326 | -2.21 |
| 5. C Customers | 466 | 506 | 8.58 |
| 6. D Customers | 2911 | 3310 | 13.71 |
| 7. Former | 981 | 971 | -1.02 |
| 8. Never | 1930 | 2339 | 21.19 |
| 9. GPA (%) | 3.12 | 3.12 | 0.00 |
| 10. 3 Month Penetration Rate (%) | 30.37 | 29.35 | -3.36 |
| 11. Households Ordering This Month | 1437 | 1633 | 13.64 |
| 12. New Customers | 365 | 425 | 16.44 |
| 13. First Time Customers | 266 | 309 | 16.17 |
| 14. Recaptured Customers | 99 | 116 | 17.17 |
| 15. Existing Customers | 1072 | 1208 | 12.69 |
| 16. Last Month’s C Customers | 501 | 466 | -6.99 |
| 17. Lost Customers | 401 | 378 | -5.74 |
| 18. C Customer Rescue Rate (%) | 19.96 | 18.88 | -5.41 |
| 19. Last Month’s First Timers | 263 | 266 | 1.14 |
| 20. Purchased Again | 69 | 91 | 31.88 |
| 21. First Timers’ Retention Rate (%) | 26.24 | 34.21 | 30.37 |
| 22. Total Purchase Frequency (%) | 1.81 | 1.71 | -5.52 |
| 23. A Customers (%) | 2.15 | 2.20 | 2.33 |
| 24. B Customers (%) | 1.40 | 1.36 | -2.86 |
| 25. First Timers (%) | 1.26 | 1.28 | 1.59 |
| 26. Regular Customers (%) | 1.94 | 1.94 | 0.00 |
| 27. 1 Month Penetration Rate (%) | 16.70 | 18.02 | 7.90 |
Qualitative Information
The third way that we want to measure our market is less exact and a little more intuitive then the strictly mathematical process used in the calculation of market penetration and purchase frequency. What we would like to measure now is customer perceptions.
Now that we have classified our market residents into various customer and non-customer groups, it is time to figure out what to say to them. What is it that, if customers knew, would cause them to buy more product? Is there a certain message that, if known by our non-customers, would cause them to try us? Who is getting the most business in town? Why do people like you and why do others not like you? The answers to these questions will help us compete with the other guys even if they have more money to spend.
Measuring customer perceptions will help us decide what to tell our various customer groups, know who our real competition is, and how well we are succeeding in our marketing efforts. (Even beyond increases in sales.) There are very real occasions when a marketing campaign will not show immediate payoffs in sales but will have a positive long term benefit nonetheless. And measuring customer perception is one way to know if we are on the right track.
The survey that can be seen on the next page measures the consumer’s perceptions of your strengths and weaknesses as well as your competition’s. Local customers rank the decision making importance of quality, price and service.
The survey quickly and easily determines how important quality (taste), price and service are to your customers and your competition’s customers. It will help you slant your message to be more effective, especially when you discover the tremendous difference in perception between your customers and your non-customers. By knowing what your chief competitor’s customers think about you, it will make the task of stealing them much easier.
The survey is designed to be quick and simple and it takes less than a minute of the subject’s time. Besides having a higher subject participation rate, it also takes less time for you to do. Therefore, it is more likely you will actually do it every quarter. Try it. You’ll be glad you did it. You only need to do one survey per market—not per store. And a friendly voice can do the survey in about 20-man hours.
Taking a periodic long view to re-evaluate your market every quarter is highly recommended. Take a look at your battle map, your market penetration and purchase frequency, and view the changes made in customer perception regarding your business. Measuring progress is the first step to making progress. See what worked and what didn’t work. Repeat the good stuff and drop the bad.
Surveying Your Marketing Area
- Select 400 names from your local phone book. Divide 400 by the number of pages and pick that number of addresses from each page in a consistently random manner. That will provide you with the 400 names. For example, the 10th phone number from the top should be selected from each column provided that that number is not a business phone. Pick the next residential number from that point.
- After you have selected the phone numbers, write them to the right of the word “phone” on the survey form. Make enough copies of this original that you can have enough copies to enter 400 numbers. Note that there are 16 forms per page so that you will need 25 copies of the original.
- Read the phone script the exact same way to each respondent and call no later than 9 p.m. You will get many people not at home or unwilling to respond. Be sure to jot a mark or note to indicate if a person has been called but has not been at home. If they don’t want to respond — write this in their blank and go on to the next person. Do not continue to try reaching a respondent who has not been home for three attempts. Go on to the next. You can quit when either you have 200 good respondents or when you have run through and exhausted all 400 numbers.
Tabulate the results in a spreadsheet in a way similar to the example provided. From this you will be able to tell what percentage of the market you own. And you will know how differently your customers perceive you compared to your non-customers. A customer is identified as one who says his next meal is coming from you compared to a non-customer who says he will get his next meal from someone else.
Quality, Service, Price Survey
Used by Telephone Surveyor
Pizza Marketing Survey 1: Determining market position and customer perceptions.
Script: Hello, my name is Steve Green with Green Advertising, and I am doing a survey to determine who has Springfield’s favorite pizza. May I ask you five very quick questions that will take less than a minute of your time?
Q1) From which restaurant delivery service in Springfield are you most likely to order your next pizza?
Q2) What is it that you most like about (insert respondent’s answer to question 1)
Choosing from Domino’s Pizza, Papa John’s, Pizza Hut or Sal’s Pizza,
Q3) Who do you think has the best tasting food?
Q4) Who do you think has the best service?
Q5) Who do you think has the best prices? Thank you so much. I very much appreciate your time.
Phone
Phone
Phone
Phone
Phone
Phone
Phone
Phone
Phone
Phone
Phone
Phone
Phone
Phone
Phone
Phone
HOW MONROE VIEWS
THE PIZZA MARKET
| Pizza Market Share: Which pizza store has the most customers? | |||||||
| Store | Little Caesar’s | Domino’s | Pizza Hut | Papa John’s | Johnny’s | Other | Total |
|---|---|---|---|---|---|---|---|
| Customers | 85 | 36 | 71 | 68 | 339 | 4 | 603 |
| Market | 14.1% | 6.0% | 11.8% | 11.3% | 56.2% | 0.7% | 100% |
| Survey participants said the following pizza stores had the: | |||||||
| Best Taste | 83 | 28 | 85 | 69 | 331 | 7 | 603 |
| 13.8% | 4.6% | 14.1% | 11.4% | 54.9% | 1.2% | 100% | |
| Service | 100 | 57 | 100 | 75 | 266 | 5 | 603 |
| 16.6% | 9.5% | 16.6% | 12.4% | 44.1% | 0.8% | 100% | |
| Price | 219 | 77 | 40 | 56 | 206 | 5 | 603 |
| 36.3% | 12.8% | 6.6% | 9.3% | 34.2% | 0.8% | 100% | |
| Johnny’s Pizza Customers the following pizza stores had the: | |||||||
| Best Taste | 10 | 0 | 16 | 4 | 306 | 3 | 339 |
| 2.9% | 0% | 4.7% | 1.2% | 90.3% | 0.9% | 100% | |
| Service | 24 | 17 | 44 | 15 | 238 | 1 | 339 |
| 7.1% | 5% | 13% | 4.4% | 70.2% | 0.3% | 100% | |
| Price | 99 | 28 | 10 | 14 | 187 | 1 | 339 |
| 29.2% | 8.3% | 2.9% | 4.1% | 55.2% | 0.3% | 100% | |
| Johnny’s Pizza Non-Customers said the following pizza stores had the: | |||||||
| Best Taste | 73 | 28 | 69 | 65 | 25 | 4 | 264 |
| 27.7% | 10.6% | 26.1% | 24.6% | 9.5% | 1.5% | 100% | |
| Service | 76 | 40 | 56 | 60 | 28 | 4 | 264 |
| 28.8% | 15.2% | 21.2% | 22.7% | 10.6% | 1.5% | 100% | |
| Price | 120 | 49 | 30 | 42 | 19 | 4 | 264 |
| 45.5% | 18.6% | 11.4% | 15.9% | 7.2% | 1.5% | 100% | |
| Papa John’s customers said the following pizza stores had the: | |||||||
| Best Taste | 4 | 0 | 3 | 56 | 5 | 0 | 68 |
| 5.9% | 0% | 4.4% | 82.4% | 7.4% | 0% | 100% | |
| Service | 5 | 1 | 4 | 51 | 7 | 0 | 68 |
| 7.4% | 1.5% | 5.9% | 75% | 10.3% | 0% | 100% | |
| Price | 20 | 5 | 1 | 36 | 6 | 0 | 68 |
| 29.4% | 7.4% | 1.5% | 52.9% | 8.8% | 0% | 100% | |
Survey Results for Sal’s Pizza
| Pizza Market Share: | |||||
| Domino’s | Pizza Hut | Papa John’s | Sal’s | Total | |
|---|---|---|---|---|---|
| Customers | 108 | 133 | 59 | 100 | 400 |
| Market % | 27% | 33% | 15% | 25% | 100.0% |
| Overall public perception of Pizza Market: | |||||
| Domino’s | Pizza Hut | Papa John’s | Sal’s | Total | |
| Has the best taste | 46 | 184 | 39 | 131 | 400 |
| 12% | 46% | 10% | 33% | 100.0% | |
| Has the best service | 175 | 51 | 89 | 85 | 400 |
| 44% | 13% | 22% | 21% | 100.0% | |
| Has the best price | 159 | 35 | 111 | 95 | 400 |
| 40% | 9% | 28% | 24% | 100.0% | |
| Sal’s customers’ perception of pizza market: | |||||
| Domino’s | Pizza Hut | Papa John’s | Sal’s | Total | |
| Has the best taste | 1 | 10 | 3 | 86 | 100 |
| 1% | 10% | 3% | 86% | 100.0% | |
| Has the best service | 40 | 6 | 14 | 40 | 100 |
| 40% | 6% | 14% | 40% | 100.0% | |
| Has the best price | 30 | 5 | 15 | 50 | 100 |
| 30% | 5% | 15% | 50% | 100.0% | |
| Sal’s non-customers’ perception of pizza market: | |||||
| Domino’s | Pizza Hut | Papa John’s | Sal’s | Total | |
| Has the best taste | 45 | 174 | 36 | 45 | 300 |
| 15% | 58% | 12% | 15% | 100.0% | |
| Has the best service | 135 | 45 | 75 | 45 | 300 |
| 45% | 15% | 25% | 15% | 100.0% | |
| Has the best price | 129 | 30 | 96 | 45 | 300 |
| 43% | 10% | 32% | 15% | 100.0% | |
| How the customers of Sal’s strongest competitor perceive the local pizza market. | |||||
| Domino’s | Pizza Hut | Papa John’s | Sal’s | Total | |
| Has the best taste | 3 | 118 | 4 | 8 | 133 |
| 2% | 89% | 3% | 6% | 100.0% | |
| Has the best service | 28 | 64 | 31 | 10 | 133 |
| 21% | 48% | 23% | 8% | 100.0% | |
| Has the best price | 40 | 41 | 32 | 20 | 133 |
| 30% | 31% | 24% | 15% | 100.0% | |
Notice how helpful this information is in designing new messages. We now know what our customers and non-customers think of us. Our next message can be more focused and more effective.