
The 1997 Manual / Section 5
Measuring Results
From the PizzaSMARTS Database Marketing Manual, updated January 1, 1997. Download the full PDF.
On this page
- Measuring Results: Probe Mailings, Period Comparison, Split Testing
- Probe Mailing
- Probe Mailings
- Pizza Smarts: One Case Study
- Case Study Results and Schedule of Mailings
- Rear View Mirror Report
- Rear View Mirror: Case Study Spreadsheet, Dec 1989 – Jan 1991
- Using Your Mailing Response Report
- How do you Market? Steering Wheel or Divining Rod?
Measuring Results
a) Probe Mailings
Test the water before you take the big plunge. Mail a small test mailing to a randomly selected representative group of customers. The mailing should include two or more different mail-pieces that have been mixed and shuffled. The response rates from your test will tell you which mail-piece will be more successful before you commit to the big mailing. You may want to determine what the minimum level of incentive is that will trigger a purchase. You will not only save marketing costs but food costs as well.
b) Period to Period Statistical Comparison
Every customer group that you will be mailing has a built-in statistic to gauge mailing response. Non-Customer mailing success can be seen by an increase in the number of new customers. Regular customer response can be measured by an increase in the monthly purchase frequency. Lost customer rescue attempts can be graded by viewing the rescue rate. New customer welcoming success can be determined by the new customer retention rate.
c) Split Population Testing
Mail to half of the population by odd or even house numbers using the unmailed population as your control group. Compare the mailed group with the unmailed group and see what the change is in the monthly activity rates. The difference between the percentage change between these groups can be attributed to the mailing. Divide the improved results by the cost of the mailing to determine your cost per person recruited (or activity increased).
PROBE
MAILING
Test the waters—
before taking the big plunge.
Know your response rate before you make that big investment.
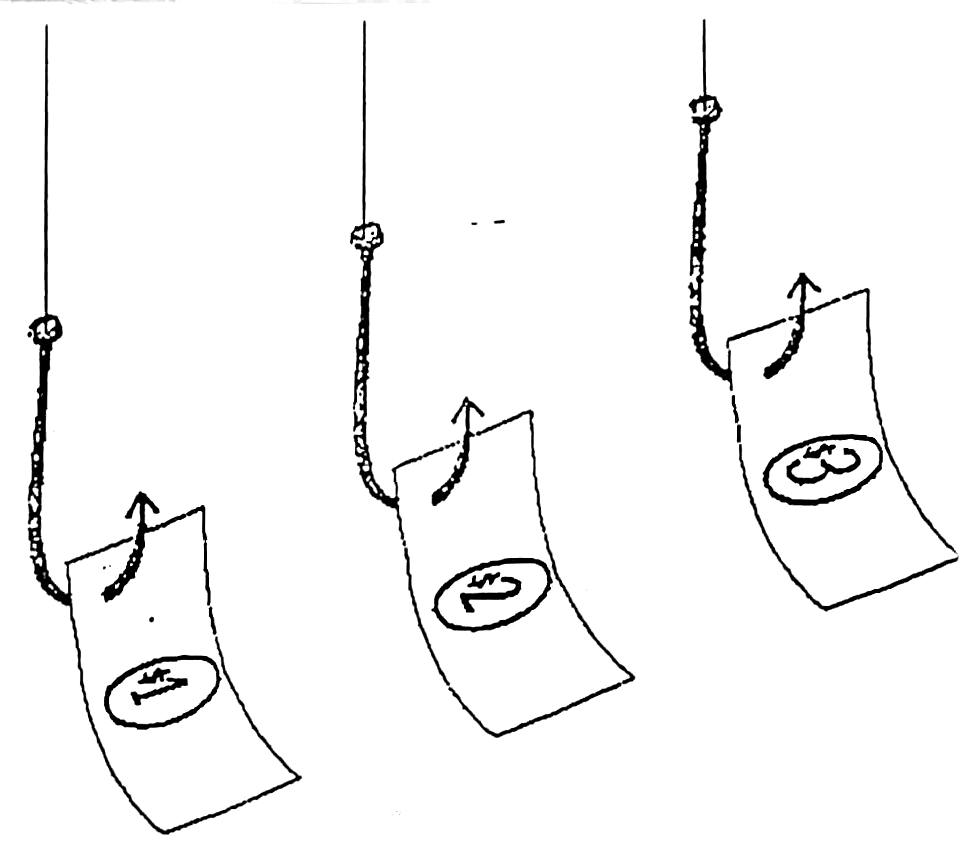
Improve the response of your mailing so that it is worth that big investment.

Probe Mailings
Test the waters before you make the big plunge.
How would you like to know the results of your mailing before you make the big investment? Wouldn’t you like to make sure your mailing will be successful?
Definition of a Probe Mailing:
A probe mailing is a small test mailing consisting of different mailing offers. These offers are mailed to your customers and, if used, are returned to your store. Here the return rates are calculated and it can then be used to forecast future mailing outcomes. Since these various probe offers hit your delivery area all at the same time you will know that the only factor affecting results is the message or coupon offer itself. This removes timing as a factor.
Two Major Advantages of Probe Mailings.
- It substantially reduces coupon cost.
This is because the probe will tell you exactly how much coupon incentive is necessary to trigger a purchase. Knowing this before the big mailing will prevent you from overselling your easy customers. - It increases the success of the mailing.
A probe can also tell you exactly what it will take to win over a new customer. It may be a price point or a special strategy that your probe can identify. Since you will know ahead of time what the best mailpiece reaction will be, your mailing is practically guaranteed to succeed.
Probe mailings can be used to test customers, non-customers, or any sub-customer group. Test premium offers, order options, or Coke combinations. Once you find out what’s hot in your delivery area, you may decide to make a general campaign out of the idea while using radio, newspaper, or any other medium.

Strategic Marketing and Response Tracking System
One Case Study
PIZZA SMARTS (Greenmail 1987-1991) has been used by over 500 delivery operations since 1987.
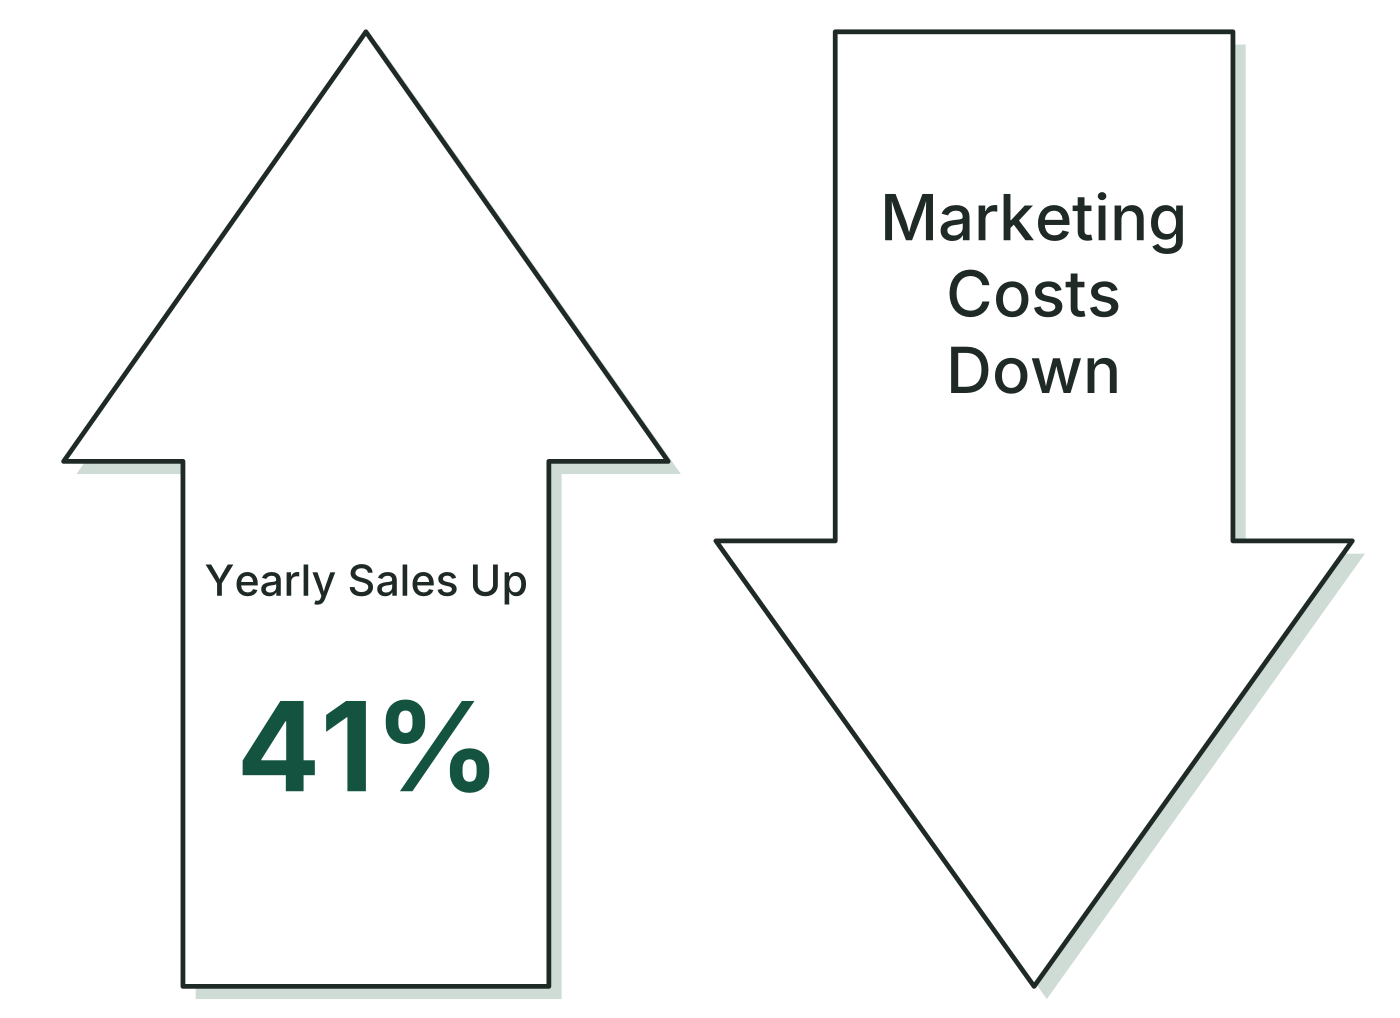
The following case study follows the progress of one store in Southern California between Dec 1989 and December 1990. The owner of this store, while achieving significant marketing goals, was able to reduce his marketing budget at the same time.
The information attached includes the timing, target, message and consequence of each mailer. Note how each mailing modestly contributes to sales but how over time sales gains are dramatic.
RESULTS
| Case Study XXXXXX Southern California | December 1989 | December 1990 |
|---|---|---|
| Customers Ordering During Month | 2574 | 3674 |
| Market Penetration Rate | 15% | 20% |
MARKETING PLAN THAT WORKS
- Mailed to Lost Customers Every Month
- Mailed to First Time Customers Every Month
- Mailed to Non-Customers Every Other Month
- Mailed to Regular Customers every 2 or 3 months
SCHEDULE OF MAILINGS
| Mail Piece | Mailing Date | Expiration Date | Results |
|---|---|---|---|
| Lost Customer Rescue | Every Month | 4 to 6 weeks | B Customers Up 36% |
| New Customer Welcome Kit | Every Month | 4 to 6 weeks | A Customers Up 37% |
| Non-Customer Mailing | March 1990 | 4/30/95 | 1st Timers Increased 50% in March 22% in April-Over Feb |
| Non-Customer Mailing | June 1990 | 7/29/90 | 1st Timers Increased Up 66% in July |
| Customer Mailing | July 1990 | 9/29/90 | Purchase Frequency Up 22% In August |
| Customer Mailing | October 1990 | 10/31/91 | Purch/Freq Up 4% |
| Non-Customer Mailing | October 1990 | 11/18/90 | Ist Timers Up 4% |
| Customer Mailing | December 1990 | 1/31/91 | Purchase Frequency Up 7% In December |
Rear View Mirror Report
The Rear View Mirror Report provides trend information for the past six months. The first section of the report contains 10 statistics which are calculated based on the last three months customer history. This is due to the fact that it takes three months of data to define each customer type. Below the dotted line are 18 more statistics which chronicle customer activity for the current month. Viewing month to month changes here gives you the ability to see changes in the long term development of your customer base.
The Rear View Mirror Report allows a marketing manager to spot intermediate term trends by lining up monthly data and looking at each element with a long view.
Rear View Mirror: Case Study Spreadsheet
| Month: | Dec-89 | Jan-90 | Feb-90 | Mar-90 | Apr-90 | May-90 | Jun-90 | Jul-90 | Aug-90 | Sep-90 | Oct-90 | Nov-90 | Dec-90 | Jan-91 |
|---|---|---|---|---|---|---|---|---|---|---|---|---|---|---|
| Total Addresses | 8567 | 10230 | 9783 | 10785 | 11270 | 12149 | 12551 | 13272 | 14018 | 14790 | 15416 | 16092 | 16802 | 17429 |
| Customers Ordering | 5191 | 5844 | 5141 | 5610 | 5357 | 5715 | 5612 | 5812 | 5973 | 6414 | 6658 | 6954 | 7121 | 7165 |
| A Customers | 974 | 918 | 878 | 909 | 999 | 1006 | 1120 | 1033 | 1217 | 1268 | 1332 | 1497 | 1512 | 1523 |
| B Customers | 3055 | 3720 | 3073 | 3389 | 3320 | 3438 | 3303 | 3518 | 3703 | 3896 | 4060 | 4153 | 4240 | 4165 |
| C Customers | 1162 | 1206 | 1190 | 1312 | 1038 | 1271 | 1189 | 1261 | 1053 | 1250 | 1266 | 1404 | 1369 | 1477 |
| D Customers | 3376 | 4386 | 4642 | 5175 | 5913 | 6434 | 6939 | 7460 | 8045 | 8376 | 8758 | 9136 | 9681 | 10264 |
| Current Months Custs | 2574 | 2982 | 2266 | 2905 | 2643 | 2862 | 2666 | 3113 | 3171 | 3455 | 3512 | 3676 | 3785 | 3647 |
| First Timers | 1297 | 1663 | 898 | 1346 | 1097 | 1193 | 824 | 1369 | 1153 | 1299 | 1346 | 1357 | 1294 | 1226 |
| Recaptured Custs | 0 | 0 | 116 | 158 | 177 | 226 | 258 | 237 | 301 | 350 | 334 | 350 | 343 | 315 |
| Regular Custs | 1277 | 1319 | 1252 | 1401 | 1369 | 1443 | 1584 | 1507 | 1717 | 1806 | 1832 | 1969 | 2148 | 2106 |
| New Customers | 1297 | 1663 | 1014 | 1504 | 1274 | 1419 | 1082 | 1606 | 1454 | 1649 | 1680 | 1707 | 1637 | 1541 |
| Lost Customers | 0 | 1010 | 871 | 1009 | 1052 | 886 | 1091 | 927 | 1036 | 875 | 1018 | 1023 | 1146 | 1145 |
| GPA | 3.0 | 3.0 | 2.9 | 2.9 | 3.0 | 3.0 | 3.0 | 3.0 | 3.0 | 3.0 | 3.0 | 3.0 | 3.0 | 3.0 |
| Batting Average | 456 | 432 | 425 | 409 | 490 | 442 | 485 | 450 | 536 | 504 | 513 | 499 | 525 | 508 |
| Number of Orders | 4906 | 5333 | 4700 | 4989 | 4435 | 5337 | 5432 | 5706 | 7074 | 6229 | 6614 | 6696 | 7389 | 6599 |
| Purchase Frequency | 1.91 | 1.79 | 2.07 | 1.72 | 1.68 | 1.86 | 2.04 | 1.83 | 2.23 | 1.80 | 1.88 | 1.82 | 1.95 | 1.81 |
Mailing Response Report
Please take time to understand this report. This report is the most important tool you have with regard to measuring the effectiveness of your marketing. The Mailing Response Report is a mirror presentation of your Mailing Quantity Report. In fact, notice that the numbers in the “total”column in the above MQR report match the “total” column below in the MRR report.
The MQR reports on the exact number of unduplicated mailings or marketing targets within each of the three categories. (Geography, Customer Type, Odd/Even). In contrast to the MQR report, the MRR reports on the marketing statistic that indicates possible success or failure with that particular target group.
For example, among the following target groups:
| Example: | Customers | Non-Customers | 1st Timers | Fading Cust |
|---|---|---|---|---|
| MQR | 3000 5.00% Quantity | 9000 1.00% Quantity | 150 15.00% Quantity | 200 7.0% Quantity |
| MRR | 1.8 10.00% Purchase Frequency | 20.00% 5.00% Market Penetration | 32.00% 18.00% Retention Rate | 24.00% 8.0% Rescue Rate |
The “3000” under Customers would come from the MQR report. This number means that there are exactly 3000 mailing targets that we would hit if we were to do a mailing this month. The “5%” under “Customers” means that the number 3000 is 5% higher than last months number of customers.
The “1.8” under “Customers” comes from the MRR report and this is the purchase frequency statistic for all customers. The “10%” under “Customers” means that the customer’s purchase frequency was up by 10% from last month.
If successful, a marketing effort to:
- Customers should produce an increase in Purchase Frequency.
- Non-Customers should produce an increase in Market Penetration.
- 1st Timers should produce an increase in the Retention Rate.
- Fading Customer should produce an increase in the Rescue Rate.
You may want to apply your marketing only to the odd numbers in your target group in order to better measure your effectiveness. That is why the additional breakdown appears on your report, so that you can measure more accurately marketing impact by geography or by target group.
How do you Market? Steering Wheel or Divining Rod?
How does your company make marketing decisions?
Is it based on gut instincts or measurable results?
Before POS systems were common, marketing decisions were only scrutinized on a theoretical basis. No one really knew who made the best marketing decision because not many people really knew how to measure results. The most successful marketing directors were those that had the ability to convince others that their decisions were, in fact, the correct ones based on esoteric theories and unexplainable insights. In today’s reality no one always makes the right decisions, and a good marketing director knows that and welcomes measurement or results so they can use it to make corrections in their marketing plan.
With measurable results favorable and unfavorable information can be used like a steering wheel to move your company along a forward moving course.
Without measurable results you are required to rely on gut feelings and the old marketing divining rod.
This wasn’t a problem in the old days because the competition was using their gut feelings too. But now, POS systems have replaced the mystery of marketing with factual data. But even though the information is in your computer, you have to be able to get it out and be willing to look at it.
I once had a client who decided that the mailing he did was a flop because his sales didn’t go up. Although this conclusion seemed to make sense at the time, the conclusion was wrong. How could this be? I analyzed his monthly activity and discovered something very interesting. The mailing he did was an especially attractive offer designed to recruit new customers. It was sent only to non-customers and resulted in three times the normal rate of new customers for the month. The mailing was obviously successful with the group that it reached, however since regular customer sales dropped at the same time of the mailing, it looked as though the mailing didn’t work.
If we didn’t have the insight provided through our database marketing program, we would have assumed that the mailing was a failure and would have scrapped an excellent sales building effort. Most marketing directors are required every day to make important decisions based on their gut feelings. If you never get contrary feedback, you’ll always think your assumptions and analyses are correct. After all, since you never know what you don’t know, there is no reality check. Savvy marketers who know how to use their computer data have discovered that their assumptions are wrong about 20% of the time. That’s because when a mailing is done one of four events occur.
- The mailing worked and we thought it worked.
- The mailing worked and we thought it didn’t work.
- The mailing didn’t work, but we thought it worked.
- The mailing didn’t work and we thought it didn’t work.
Most of the time the gut level marketer and the measurable result marketer will agree and make a correct evaluation as in situation 1 and situation 4. But then . . . what about situations 2 and 3. Why believe information that is 80% truthful when you can get information that is nearly 100% truthful. You’ll end up being 20% smarter and probably spend a lot less money.