
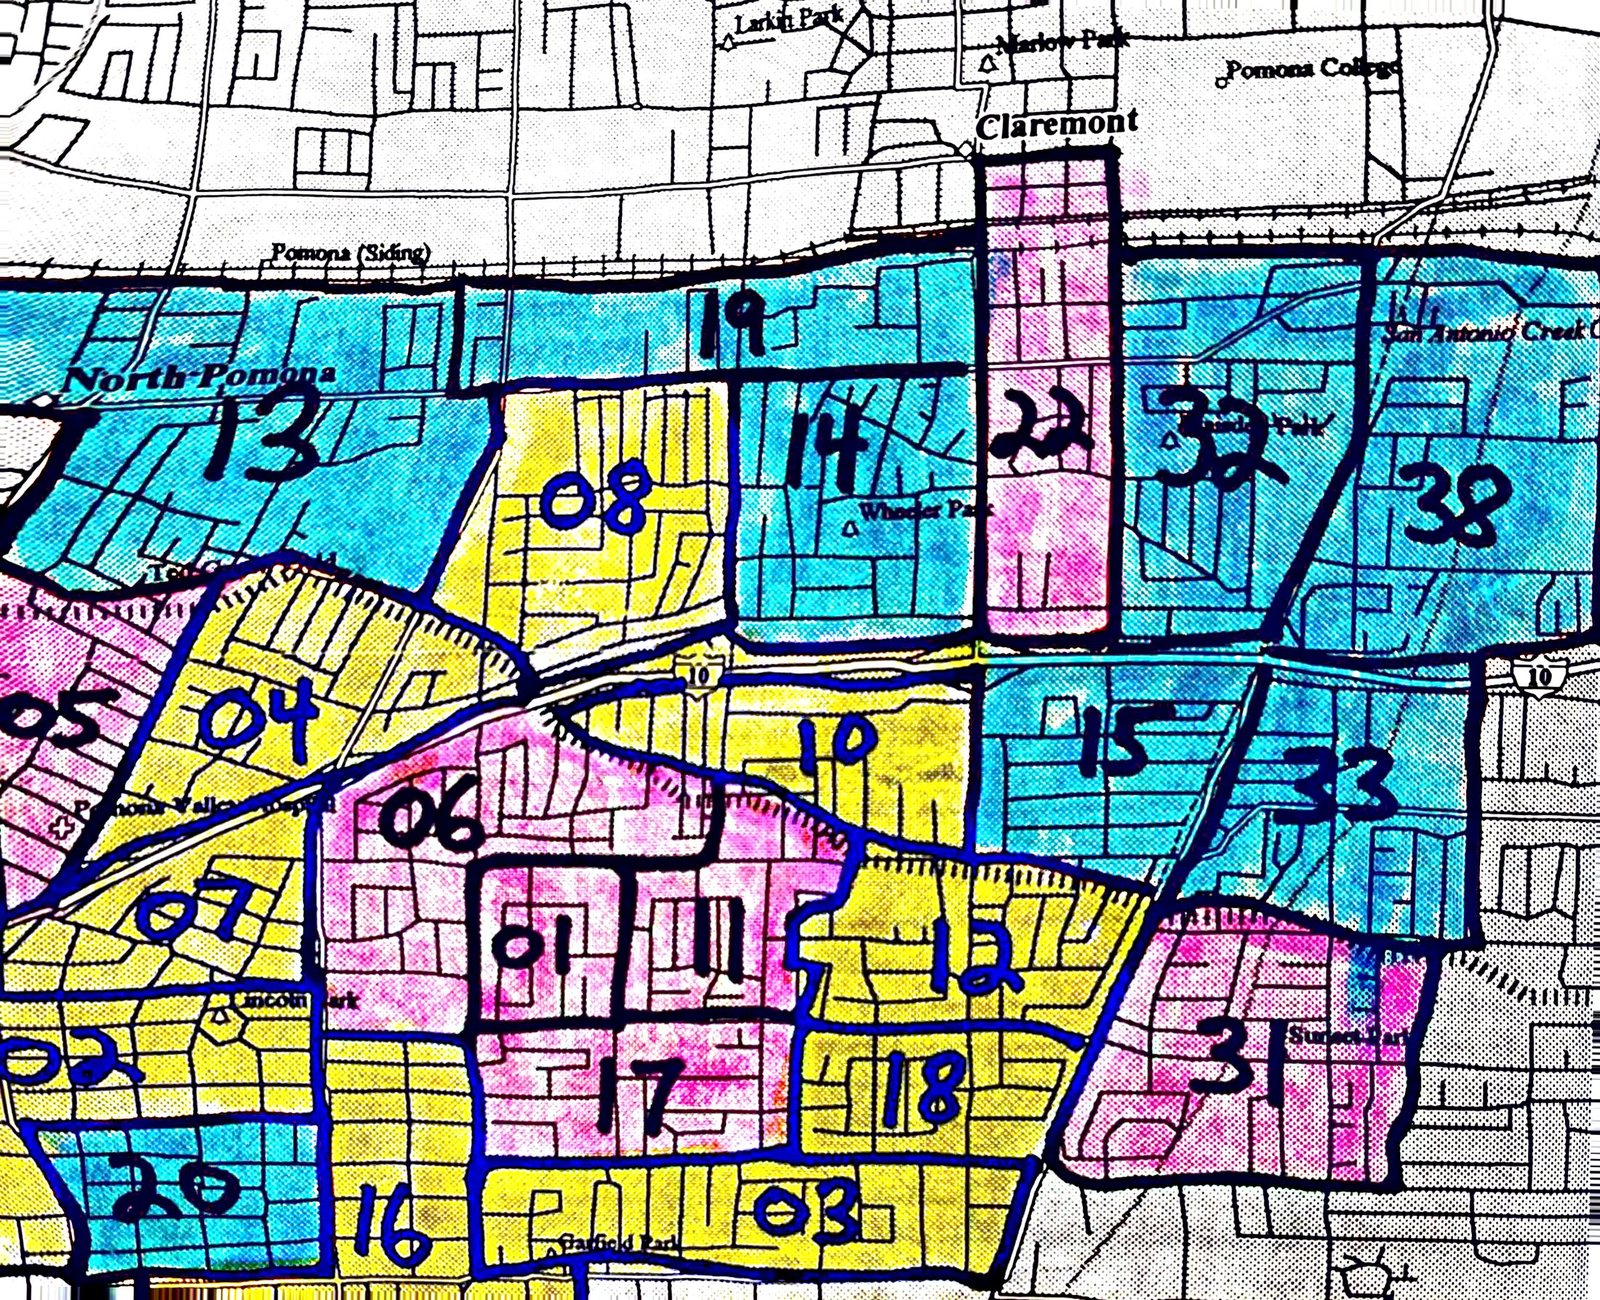
Where do your customers actually live? Not in the neat circle around your store you might picture. PizzaSMARTS answered the question with a hand-colored map of every postal carrier route in the delivery area, shaded by how many of its households were customers.
From the 1997 manual
“A market penetration map is the closest thing to a photograph of your business you will ever see. You can see where your customers are coming from. Where you have the most influence. How competition and traffic patterns can warp the neat population radius you expected to see.”
Market Penetration Analysis, Analyzing Market
How the battle map worked
For each carrier route, PizzaSMARTS divided the number of active customers (anyone who ordered in the last three months) by the number of households the Post Office delivered to. Then it ranked the routes and split them into thirds:
- Red zones: the top third, where you have the most influence.
- Yellow zones: the middle third.
- Blue zones: the bottom third.
In the manual’s sample market, red-zone routes ran from about 40% to 58% penetration, while some blue routes were near 12%. The advice that followed: market to customers wherever they live, but recruit non-customers in the red zones first. “Here your non-customer response rates will be significantly higher than from other parts of your market.” A route where 30% of households already order from you is close to twice as likely to produce new customers as one at 15%.
How to do it today
- Count active customers by area. From your order data, count customers who ordered in the last three months by ZIP code, or by carrier route if your addresses can be matched to routes.
- Get household counts for the same areas. The USPS Every Door Direct Mail tool shows the number of residential addresses on each carrier route, so the 1997 method lines up directly with today’s neighborhood mail.
- Divide, rank and split into thirds. Red, yellow, blue. A spreadsheet does it in minutes.
- Put it on a map. Free mapping tools can shade areas by a number. Look for the surprises: a strong route far from the store, a weak one next door, a road or a competitor that cuts your area in two.
- Aim new-customer marketing at the red zones. Postcards by carrier route, door hangers, and neighborhood-targeted ads, starting where your response will be highest.
- Redraw it every quarter. The manual called it watching “geographic victories and losses.” A zone that turns from yellow to red tells you a campaign worked there.
What to measure
Market penetration by area, every month or quarter. Watch whether the zones you marketed to moved up compared with the zones you didn’t; that’s a geographic control group.
That’s the whole playbook: grade your customers, talk to each grade differently, welcome first-timers, rescue the fading ones, test everything against a control group, and keep score with the right numbers. To see where these ideas are headed next, read about the platform, or start with the original 1997 manual.